Object Visibility Plotter

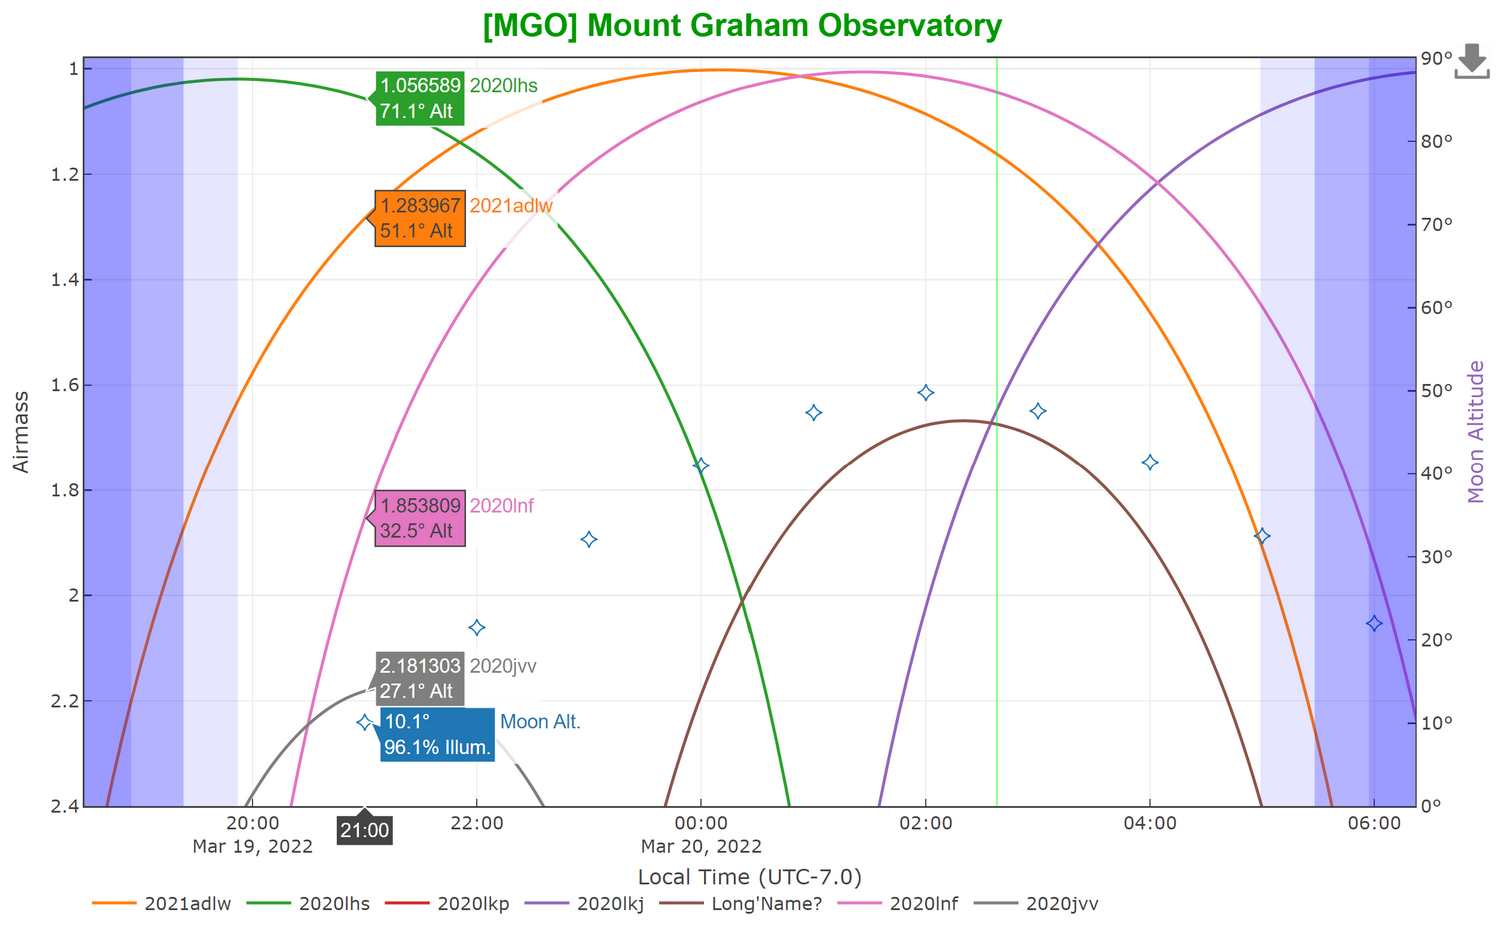
This tool plots the airmass (and altitude values) for an object or a list of objects given its RA and Dec for any given date. See demos: Single Object, Multiple objects, Demo3. Additional features include:
- Can plot a single object or a list of objects with their names and corordinates as input.
- Plot of Moon altitude and percent illumination values.
- Civil, nautical, and astronomical twilight zones are shown by three color bands.
- Current time is shown by a vertical line.
- Set of predefined observatory sites for easy selection are provided.
- User can also input user-defined site information, i.e, lat-long and time-zone.
- Custom location can be picked from a dyanmic searchable map.
- Date input also accepts text like 'Today', 'Tomorrow', 'Yesterday', 'Next week', 'Last week', 'Last month' etc. This way you can have a plot-link configured, which on opening will plot for the given time offset, instead of a fixed date.
- You may embed these plots or links in your website to dynamically generate these plots by changing the parameters in the URL.
You may either use the tool from below or open in an external window, from there you can share or save your plot configuration using the address bar URL.
All visibility calculation are done from scratch without using any third-party library. Although it has been extensively used internally and debugged before making it public, please let me know if you find any incorrect result.
Found a bug? report here.
Changelog
March 20 2022:
- Major update: Now suports plotting of multiple objects togather with object list as input. Full backward compatability retained.
- Custom observatory location can be picked from a searchable map.
- Option added to select computer's time zone.
- Several minor changes.
March 14 2022:
- Now DST is handled correctly when plot-range starts on DST chnage date and also when using relative dates.
February 11 2022:
- Added vertical line in plot to show current time.
- Improved date selection when realative date (today, tomorrow, etc.) is used. Now timezone is also taken into account with a added buffer of 6Hr to select start date.